Data & Analytics
Build Your Own Email Benchmarks


What's a good open rate for email? What's a good click through rate?
The answer? Ask your data!
Every marketer wants to know how their campaigns are performing against the industry benchmark so they can demonstrate the value of their expertise. But industry benchmarks aren't always the best for comparison. Email – when done the right way – is a curated, personalized, niche means of communication.
Because every email list is distinct, whether your subscriber count is in the several hundred or several million, your audience has a specific mix of characteristics and will perform according to those traits. Once you send a single email to that subscribership (or a segment within it) you have historical data to start building your own benchmarks.
Start With One
Once the first email has deployed, your ESP starts collecting subscriber data: opens, clicks, unsubscribes, and spam complaints. Over the next few hours, days or even weeks, your ESP uses this data to form your very first benchmark.
Will it be good? Will it be bad? You won't yet know until you send your second email, your third email, and so on through the end of that campaign.
The data from your first campaign deployment is ultimately neutral. Without historic data to compare it against, you can't judge its success internally. You can, however, compare it to any of the myriad industry benchmarks for a quick pulse check – but don't let an industry benchmark ruin your campaign's performance. Even if your initial numbers look bad when compared to the industry benchmark, remember that a single email isn't an accurate representation of how your overall audience will perform over time. To get that insight, you have to start building smart benchmarks.
Smart Benchmarks
Any statistician will tell you that a single data point lacks context and offers you zero visibility into what you're attempting to measure. To get a clear picture, you'll need more data points.
A smart benchmark doesn't just measure key metrics; it also shows performance directionality. In effect, it is a vectored benchmark, because it gives you both the magnitude of your audience's performance, and the direction that performance is going. And to capture that direction, you need more campaigns.
Smart Benchmark Intervals
To build a vectored benchmark, you need to determine your lookback interval based on send frequency. For example, a monthly campaign won't be able to use a one-week lookback.
So, how long should the lookback period be? The answer to that question is at least three deployments. Why three? Three points will provide the minimum logical information required to establish a trend for our smart benchmarks.
From there, we can extrapolate ideal minimum lookback intervals based on campaign cadence:
| Campaign Cadence | Smart Lookback Interval |
|---|---|
| Daily | 3 Days |
| Weekly | Three Weeks |
| Monthly | Three Months |
| Bi-Monthly | Six Months |
| Quarterly | Nine Months |
Smart Benchmark Data
Once your lookback intervals are set, you need to select the right data inputs. Choosing the wrong data will lead to inaccurate benchmarks.
First, group your email data by campaign type. This ensures you're looking at homogenous subscriber cohorts with a shared interest in that message type. Overlap is completely acceptable – a single subscriber can exist in several cohorts, or only in one.
If you only send a single monthly newsletter, this step is simple – your whole list is the cohort. For companies with lots of different campaigns across varying cadences, organizing these groups takes a bit of initial manual work. The good news? Once you set up these audience cohorts, the framework remains in place for all future benchmarks.
Time To Build Your Smart Benchmark
With your lookback interval set and your data curated, calculating your benchmark is fairly straightforward: add your three data points for any statistic together, and then divide the result by three!
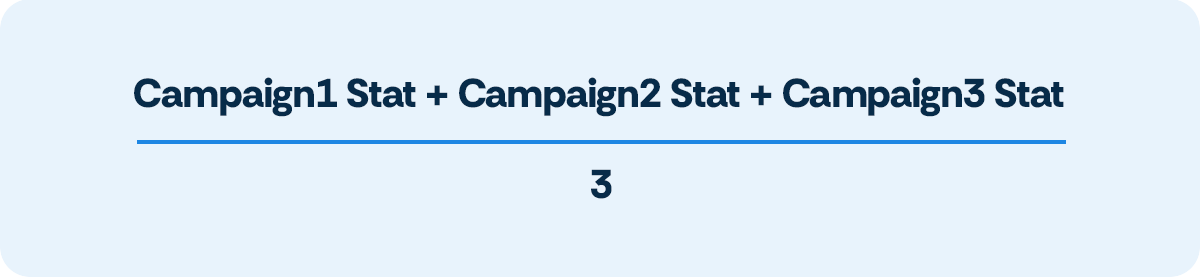
This same logic applies as you gather data from future sends:
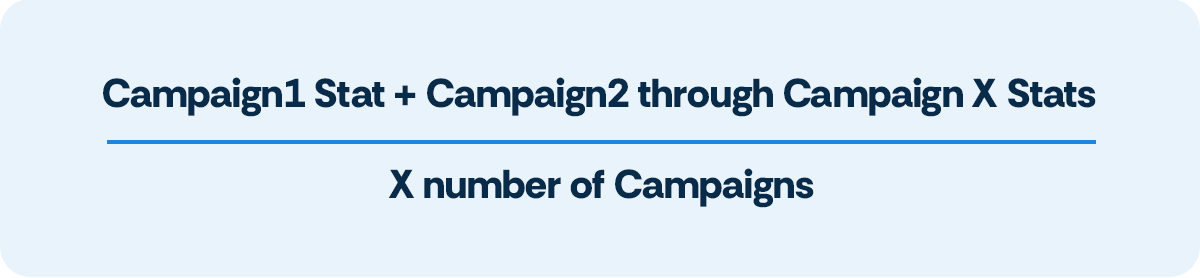
So what smart benchmarks should you build? All of them. Building baselines across every core email metric gives you a clear, full picture of both the individual campaign health and overall audience engagement.
Good luck and happy sending!